Understanding Heat Maps
Color Gradients
Luminance mapping represents light intensity across a space using color gradients. Warmer colors indicate higher light levels, while cooler colors show areas with less illumination. This visualization helps identify uneven distribution and problematic dark zones.
Spatial Context
Three-dimensional wireframe models provide spatial context for light placement. By overlaying heat map data onto these models, we can see how light travels through space and where fixtures should be positioned for optimal coverage.
Eliminating Dark Zones
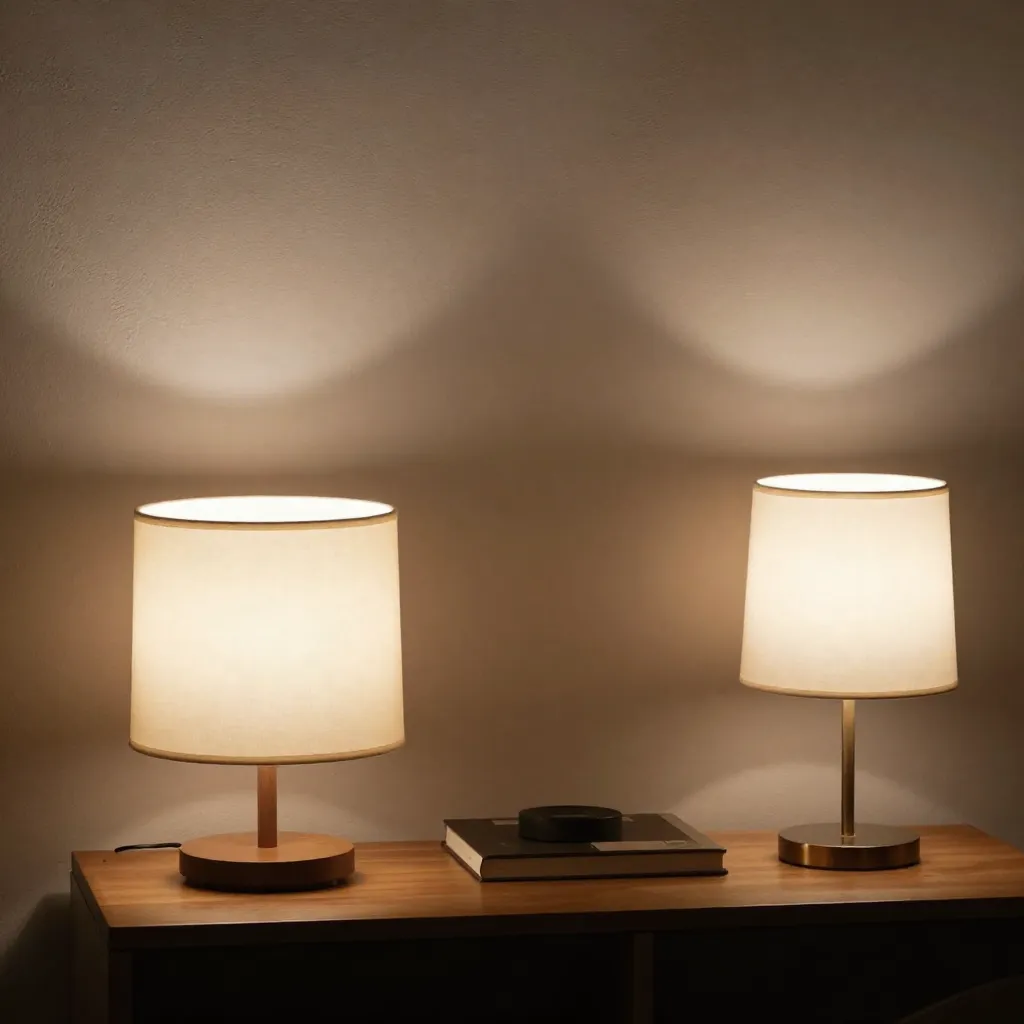
Layered Fixture Placement
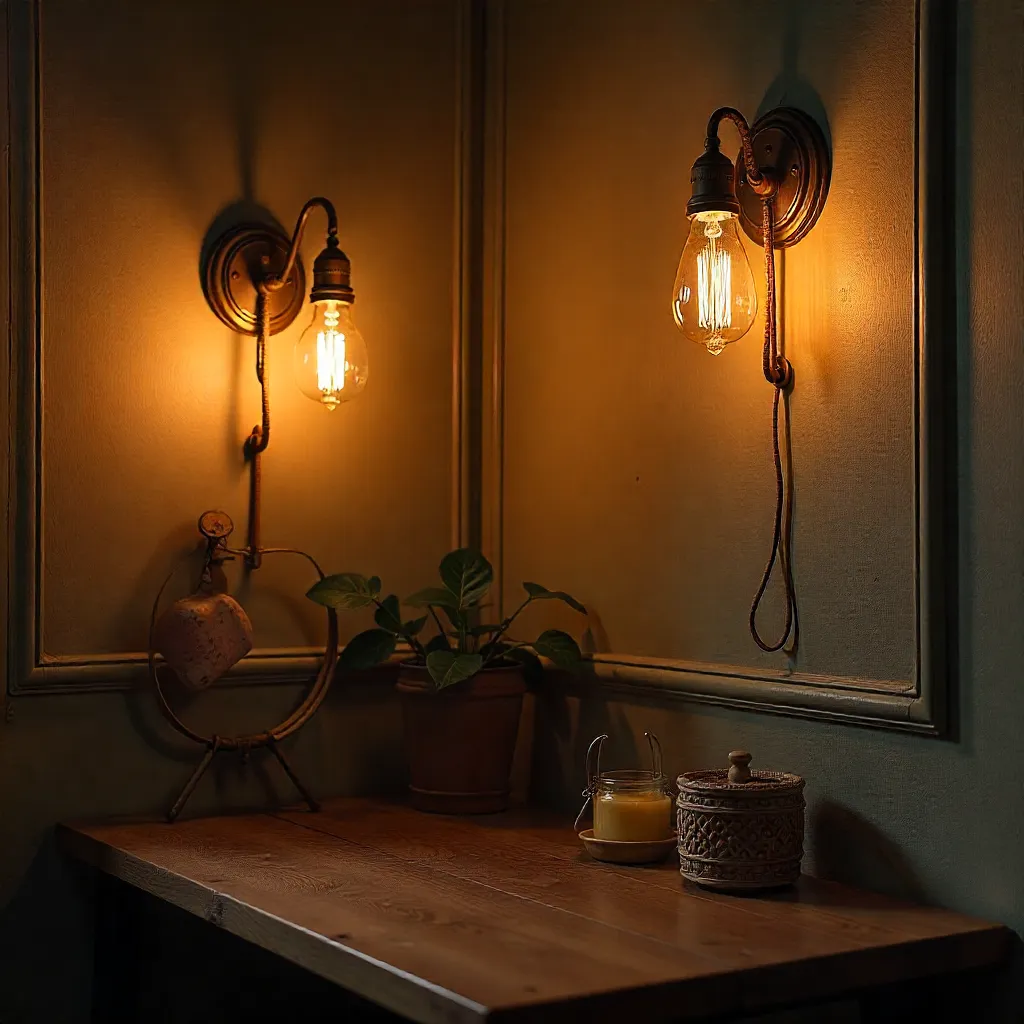
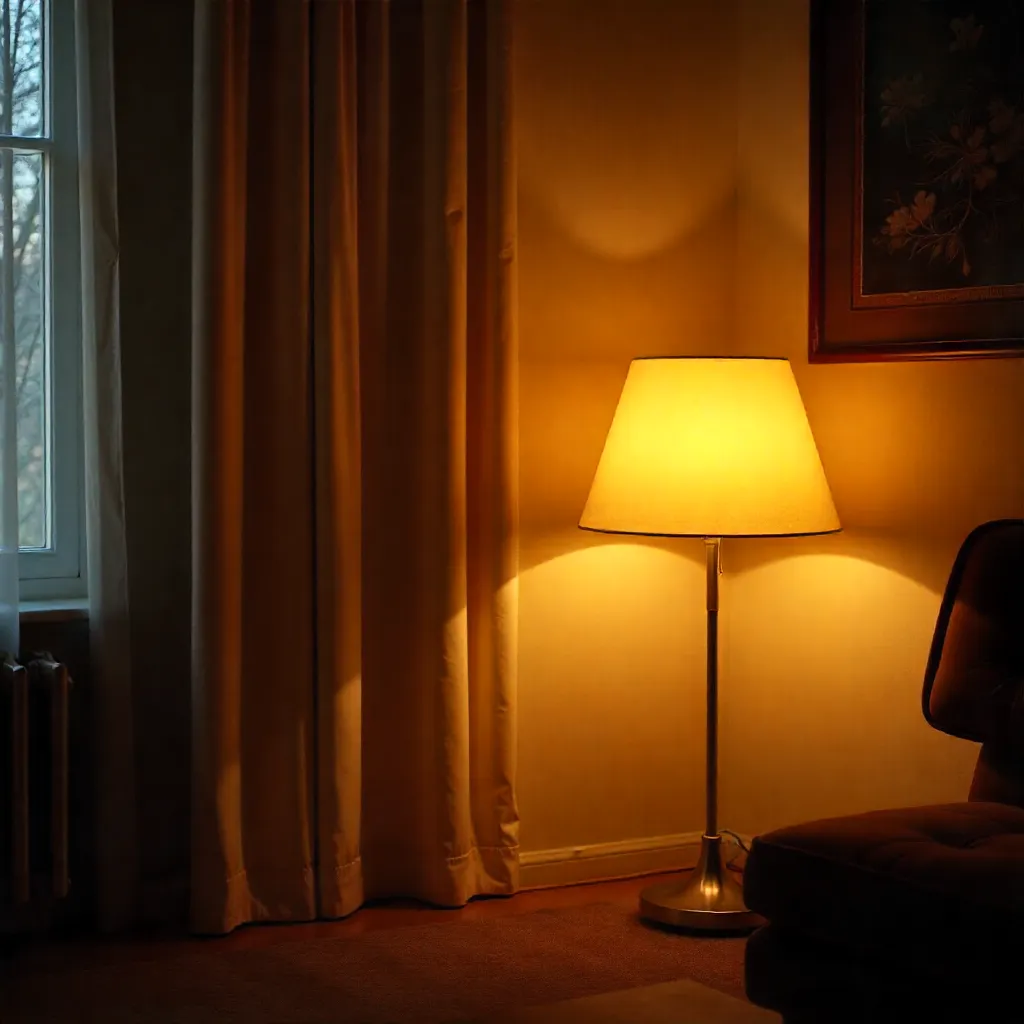
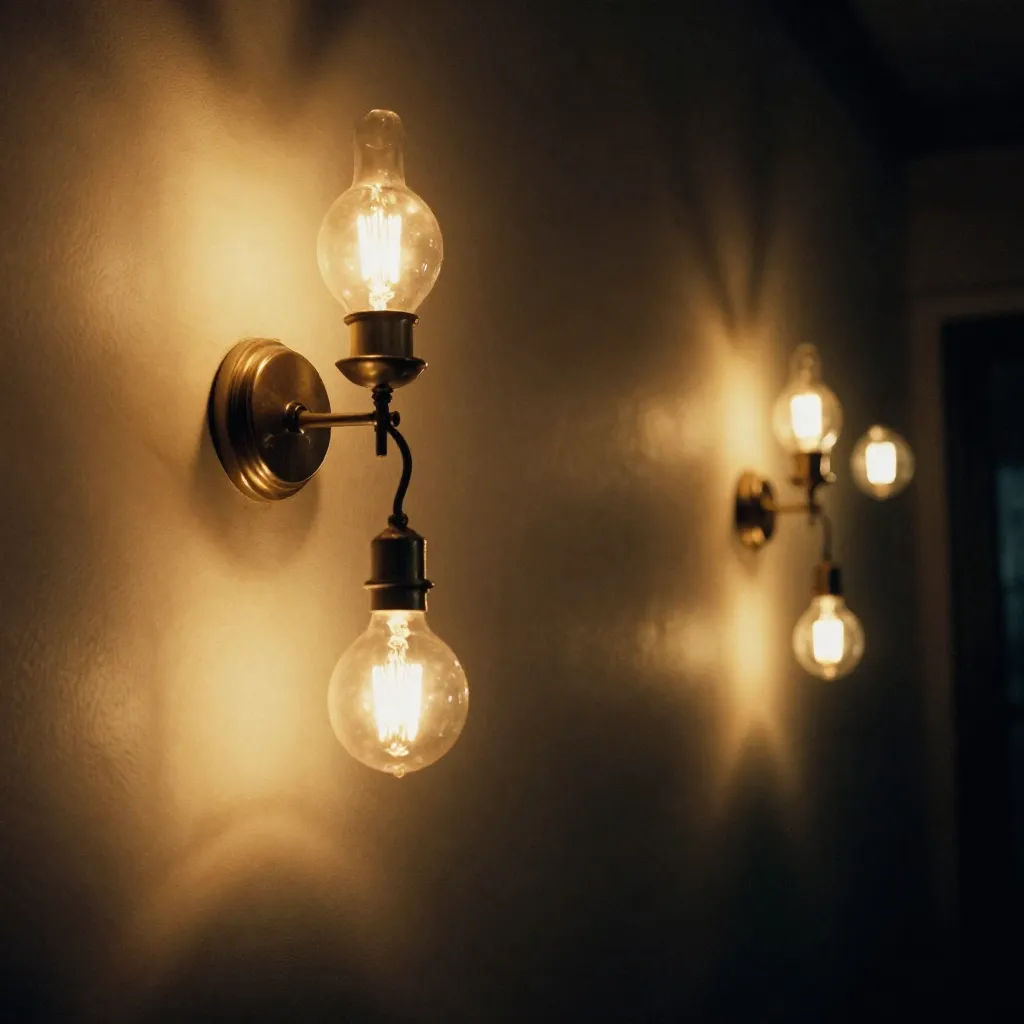
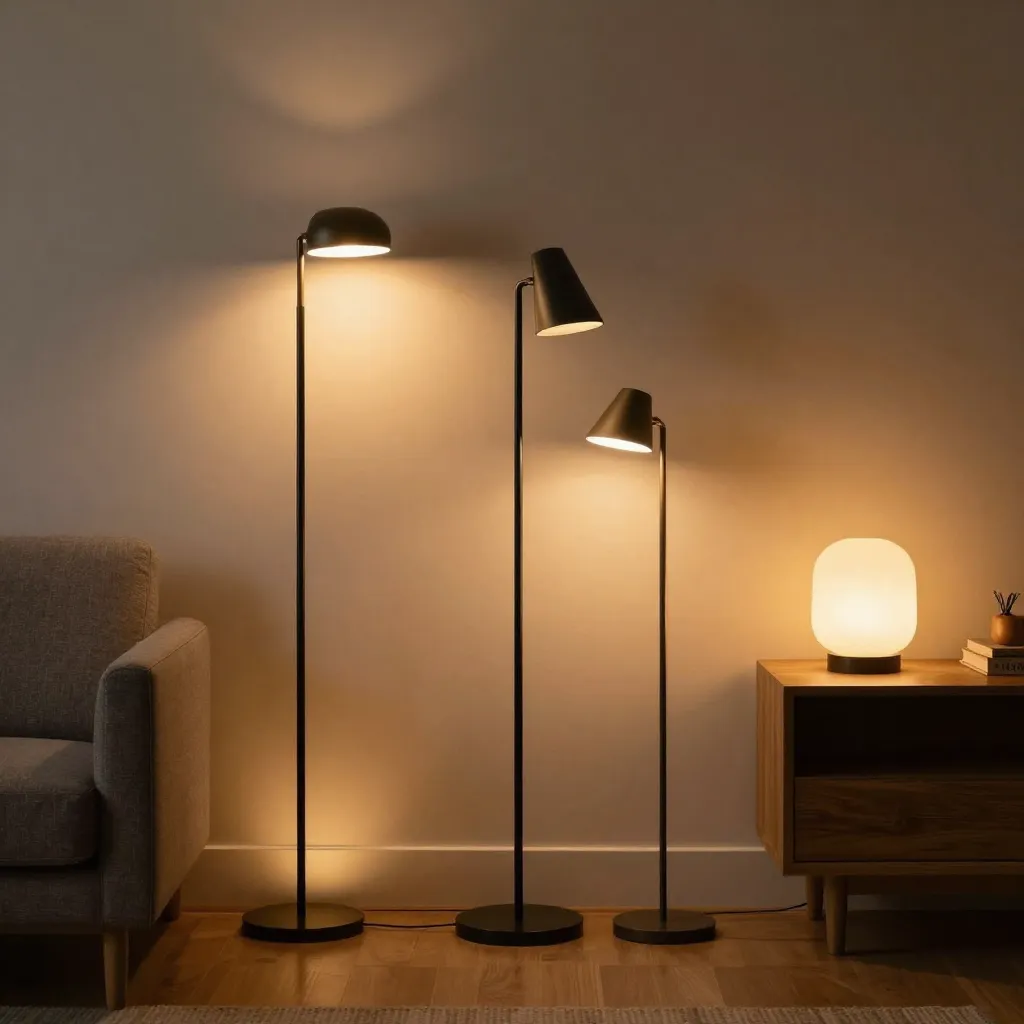
Using multiple light sources at different heights and angles ensures comprehensive coverage. Overhead fixtures provide general illumination, while wall-mounted and floor lamps fill gaps and eliminate shadows.
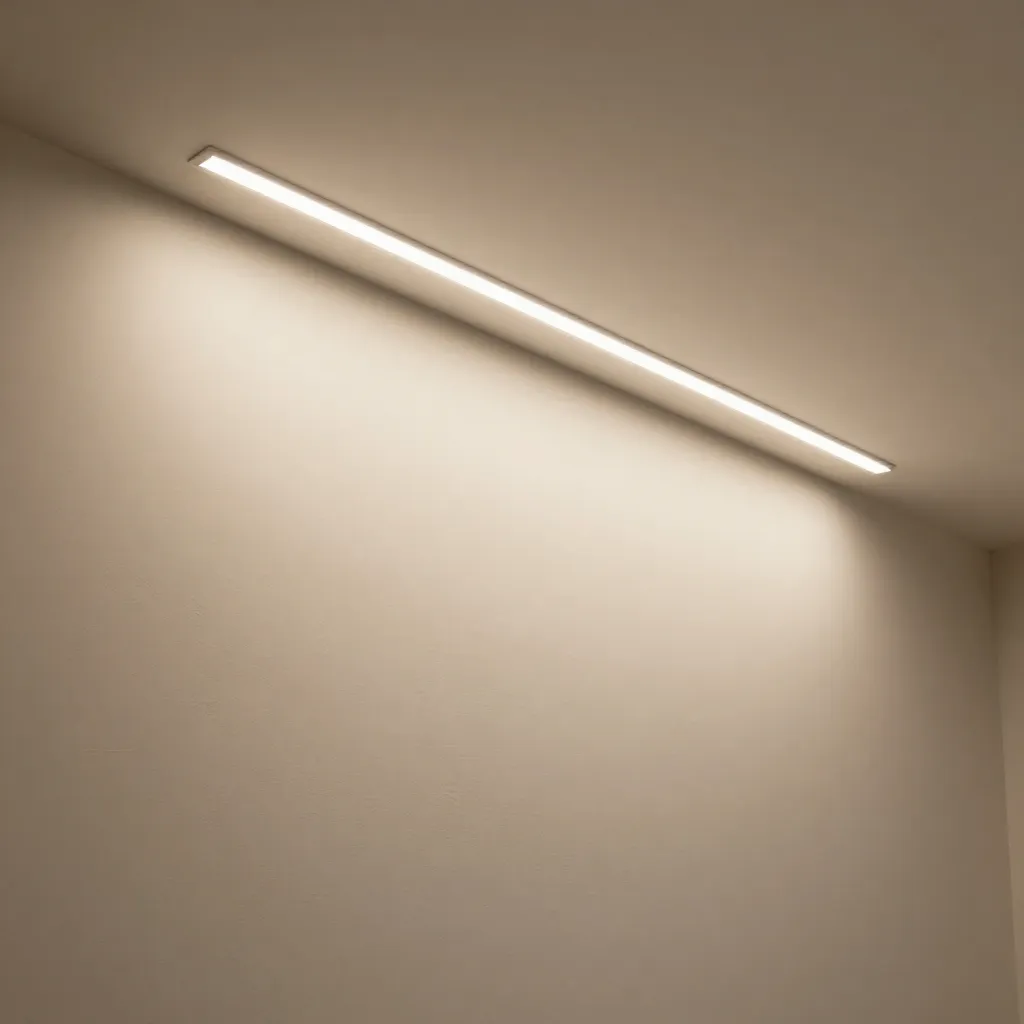
Reflective Surfaces
Strategic use of mirrors and light-colored surfaces helps distribute light more evenly. These elements bounce illumination into areas that direct light cannot reach effectively.
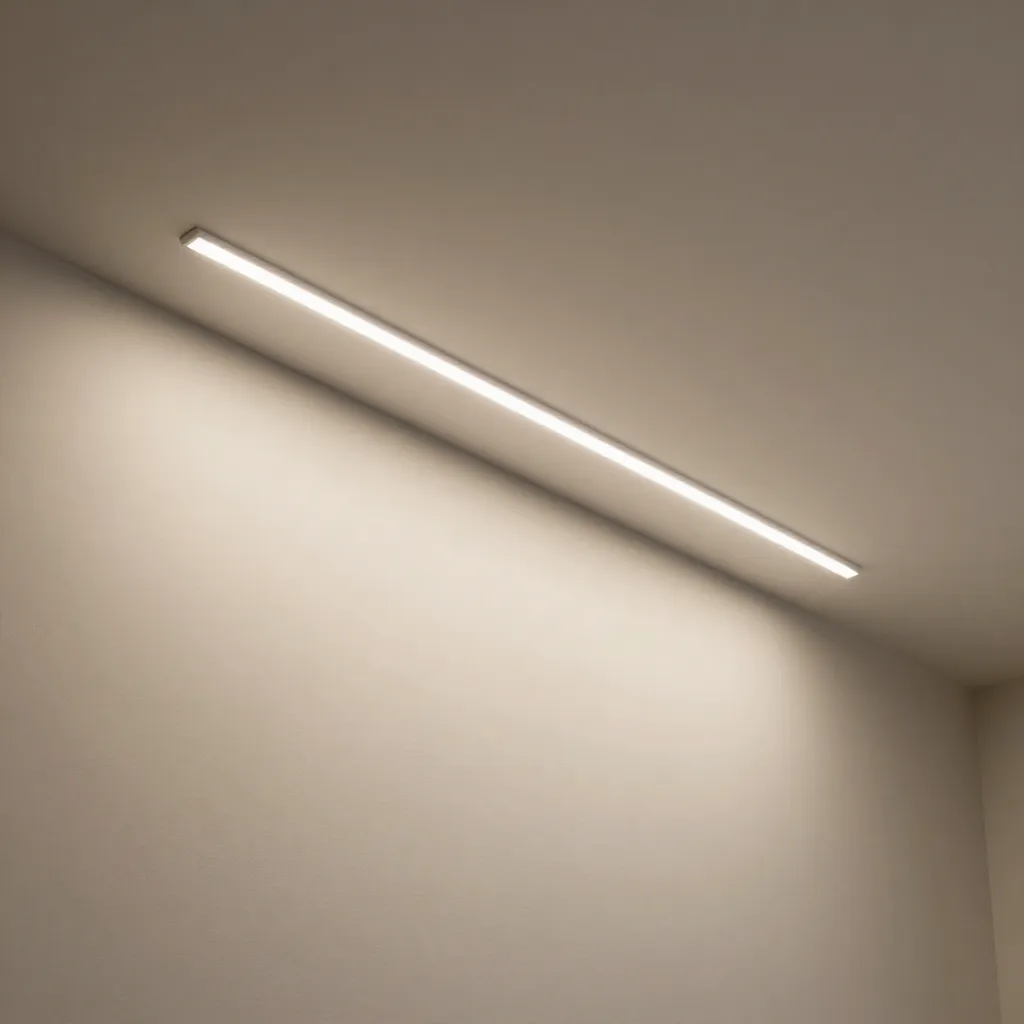
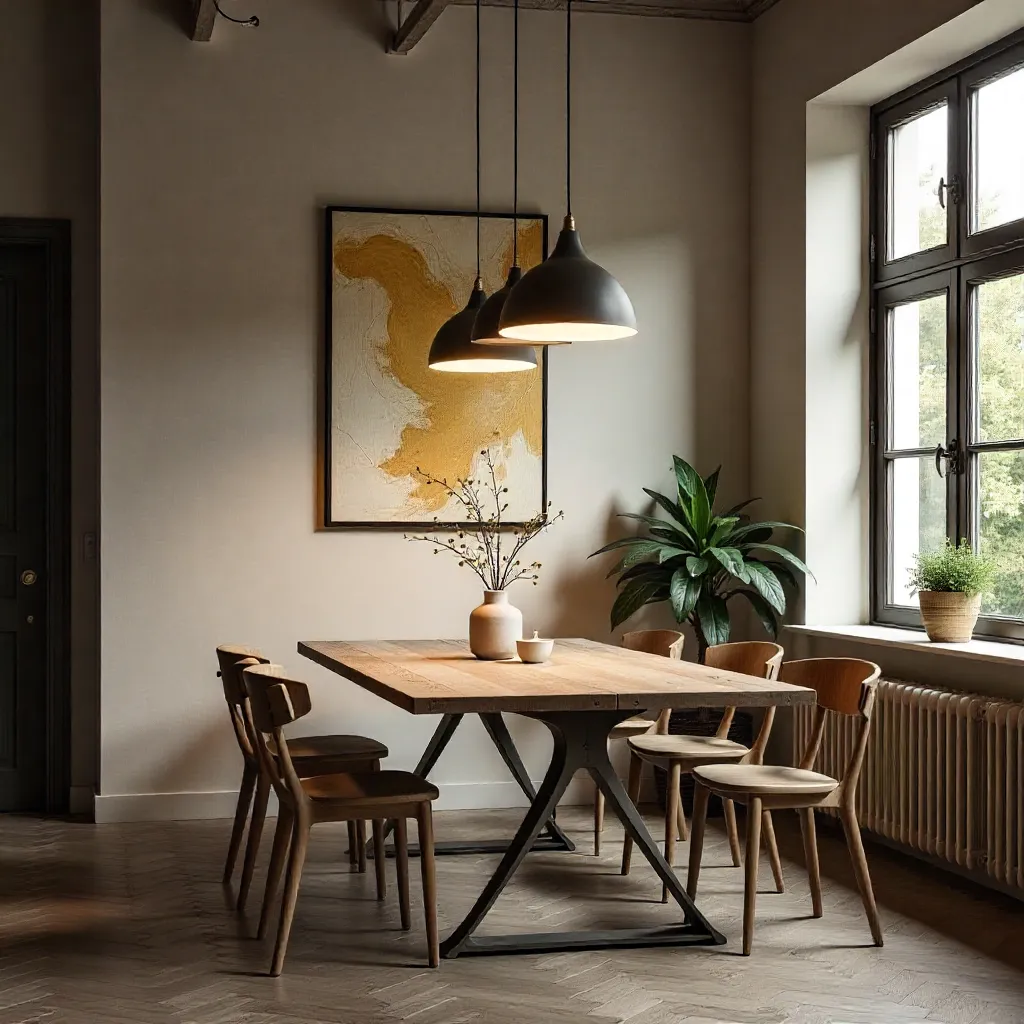
Beam Angle Selection
Choosing fixtures with appropriate beam angles ensures light spreads to cover intended areas. Wide beams work well for general illumination, while narrow beams create focused accent lighting.
Technical Analysis
Lux Measurement
Lux meters measure illuminance at specific points, providing quantitative data for mapping. Recommended levels vary by activity: 300-500 lux for general spaces, 500-1000 lux for task areas.
Uniformity Ratios
Uniformity describes how evenly light is distributed. A ratio of minimum to average illuminance above 0.7 indicates good uniformity, reducing visual discomfort from brightness variations.